Report Builder in Ripple
The Report Builder tool provides Site Managers and Site Admins with a flexible way to generate custom reports your Ripple site's data. Users can select specific data points measures and dimensions to create ad hoc reports in a table format. Users can export the data into Excel for further analysis.
Key Features of Report Builder
-
User Access:
- Users must have Site Managers or Site Admin permissions to build a report.
- Users can only generate reports for studies in which they are assigned.
-
Customizable Reports:
- Select various measures and dimensions to build tailored reports.
- View data in a structured table format.
-
Saving & Sharing Reports:
- Reports can be saved for easy access and future use.
- Saved reports can be shared with any user on the account.
-
Data Export:
- All report data can be exported as a CSV file for further analysis or external use.
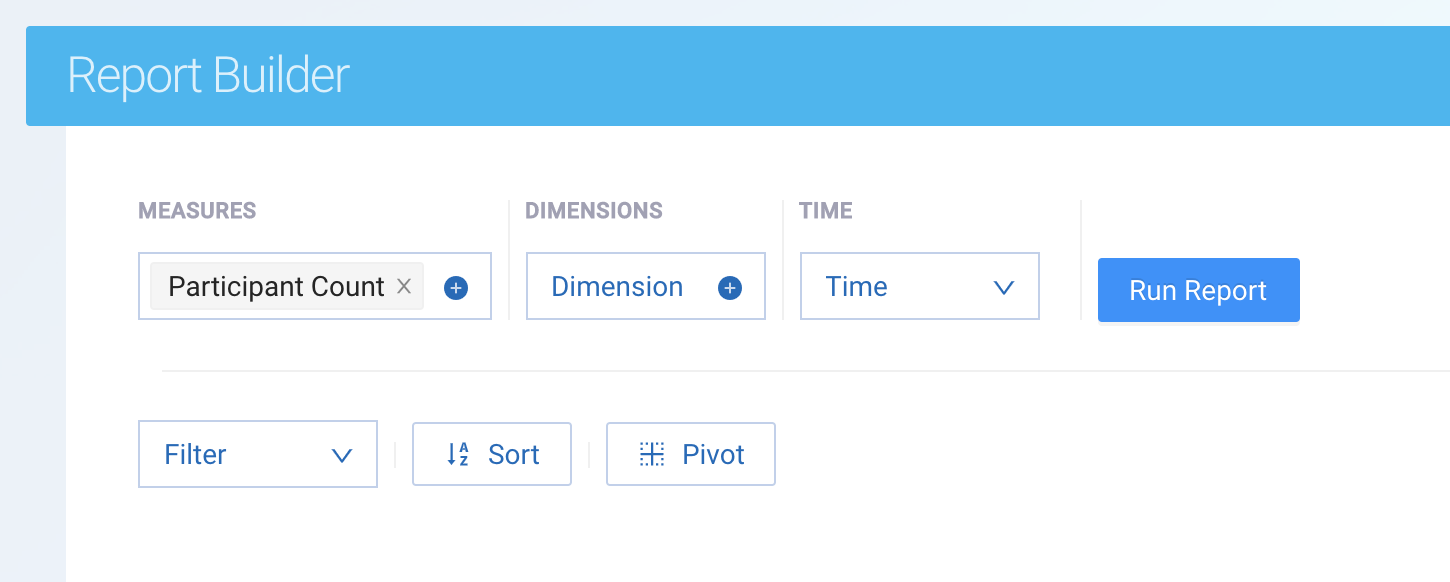
Anatomy of a Report in Ripple’s Report Builder
Ripple’s Report Builder allows users to generate custom reports by selecting Measures (numerical values) and Dimensions (grouping criteria), Time Dimensions, Filters, Sorting, and Pivoting. Understanding these components ensures accurate and meaningful data reporting. These tools help tailor reports for deeper insights and streamlined data analysis.
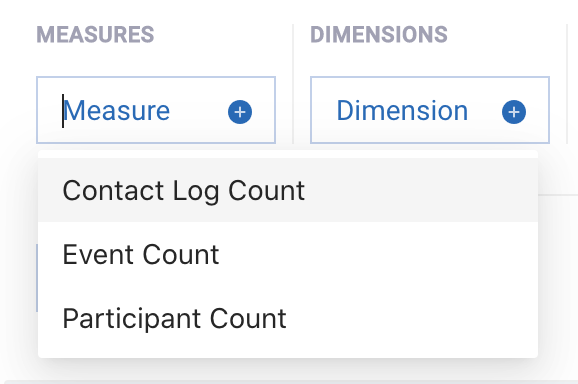
Measures (Numeric Data Points)
The Measures dropdown contains summed numerical values that can be added to reports. Available measures include: (optional)
1. Contact Log Count
-
Represents the total number of contact logs a user has access to.
-
Includes study-specific contact logs.
-
Global contact logs are included unless the data is broken down by a study-specific dimension.
2. Participant Event Count
-
Represents the total number of participant events across studies the user has access to.
-
Events are study-specific and cannot be combined with global-only dimensions.
3. Participant Count
-
Represents the total number of participants within the account.
- When combined with study-specific dimensions, only participants assigned to the user’s studies will be counted.
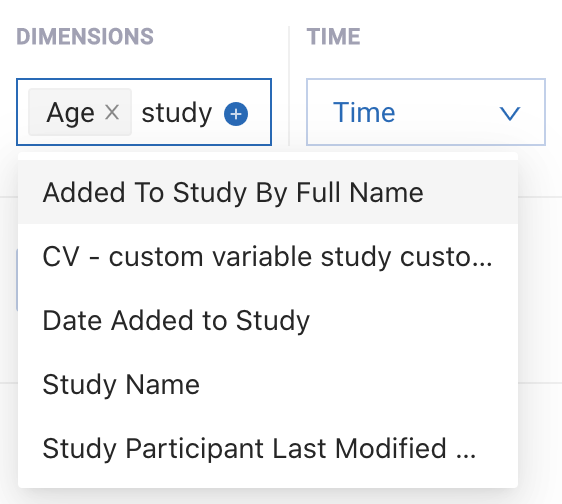
Dimensions (Grouping Data in Reports)
The Dimensions dropdown provides categorization options for Measures. Users can also generate reports using only Dimensions (without numerical Measures).
- Each selected Dimension appears as a column in the report table.
- Multiple Dimensions can be selected per report.
- Use Filters to limit data without displaying additional columns.
Some Dimensions may not directly relate to selected Measures, so be mindful when combining them.
Types of Dimensions
The type of Dimension selected affects report results based on user permissions and the dimension category:
1. Participant Profile Data
-
Includes demographic details like ethnicity or age.
-
Available for all participants, regardless of study participation.
-
Data is aggregated across all studies based on the selected dimension.
2. Study-Specific Details
-
Includes event-related data that can only be retrieved from within a study.
-
Only data from the user’s assigned studies will appear in the report.
3. Global Data
-
Includes data collected within a study or from the registry, such as Contact Logs.
-
Global data tables will include:
-
All globally marked data.
-
All study-specific data from studies the user has access to.
-
4. Custom Variables
-
Custom variables can be study-specific or global.
-
Global custom variables are accessible to all Report Builder users.
-
Study-specific custom variables will only display data for studies assigned to the user.
Using Measures and Dimensions Effectively
-
Choose Dimensions carefully to ensure meaningful grouping of data.
-
Use Filters instead of adding unnecessary Dimensions when limiting the dataset.
-
Understand data availability—some Dimensions and Measures are restricted based on user permissions and study access levels.
By understanding the Anatomy of a Report, users can generate clear, accurate, and insightful reports tailored to their research and operational needs.
Enhancing Reports with Time Dimensions, Filters, Sorting, and Pivoting
The Report Builder in Ripple allows users to refine and organize reports using Time Dimensions, Filters, Sorting, and Pivoting. These tools help tailor reports for deeper insights and streamlined data analysis.
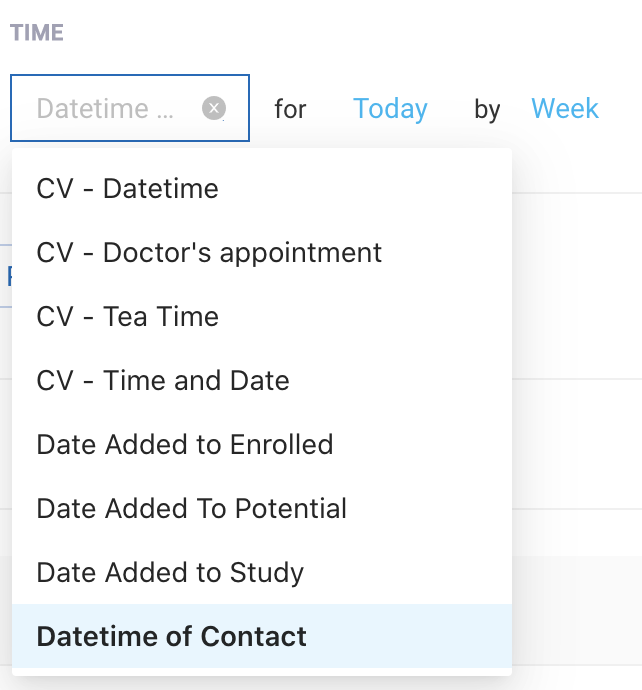
Time Dimensions
Reports can be filtered based on specific date fields, including custom variables.
How to Apply Time Filters:
- Open the Time dropdown.
- Select a date field (e.g., event date, participant enrollment date).
- By default, the filter is set to “Today”. Click it to:
- Choose a preset range (e.g., Last 7 Days, Last Month, etc.).
- Select “Custom” to enter a specific date range.
Grouping Data by Time Intervals:
- The Grouping option allows you to organize data by Year, Month, etc.
- By default, the report does not display dates (w/o grouping).
- Changing this setting adds date-based aggregation to the report.
Filters
Filters refine reports by narrowing down results based on any measure, dimension, or data point.
How to Apply Filters:
-
Open the Filters dropdown.
-
Select a field to filter (available fields are listed regardless of the selected Measures and Dimensions).
-
Choose a comparator, depending on the data type:
- Text Comparators:
- Contains
- Does Not Contain
- Equals
- Does Not Equal
- Is Set / Is Not Set
- Number Comparators:
- Greater Than (
>) - Greater Than or Equal (
>=) - Less Than (
<) - Less Than or Equal (
<=)
- Greater Than (
- Text Comparators:
-
Enter values in the text field. Multiple values create an "OR" filter.
-
Adding multiple filters applies an "AND" condition, meaning all filters must be met.
Sorting Data
Use the Sort dropdown to control how data appears in the report.
- By default, sorting is set to “None”.
- Change the setting to:
- Ascending (A → Z, lowest → highest).
- Descending (Z → A, highest → lowest).
Sorting makes it easier to identify trends, outliers, or key insights in the dataset.
Pivoting Data for Better Visualization
Pivoting allows users to rearrange report data by switching rows and columns.
How to Pivot Data:
- Drag and drop data points from the "x" column (rows) to the "y" column (columns).
- Reorder multiple measures and dimensions by dragging and dropping their names in the Pivot dropdown.
- Pivoting requires at least one Measure for it to work.
- Pivoting only affects how data appears in the application—pivot settings are ignored when exporting data to CSV.
Additional Options: Managing Missing Dates
- The Options tab includes a checkbox for “Fill Missing Dates”.
- When enabled (default setting), the report displays all time groups (even if they have no data).
- When disabled, only time groups with data will appear.
By leveraging Time Dimensions, Filters, Sorting, and Pivoting, users can create highly customized reports that enhance data interpretation and decision-making within Ripple’s Report Builder.
Running a Report in Ripple’s Report Builder
Once you have selected a Measure or Dimension, the “Run Report” button will become active. This button ensures that the displayed table reflects the most recent selections and updates.
How to Run a Report
-
Select Measures and Dimensions
- Choose at least one Measure (optional)(numerical data) or one Dimension (categorization).
-
Make Additional Customizations (Optional)
- Apply Time Filters to define a date range.
- Use Filters to narrow the dataset.
- Adjust Sort settings for ascending or descending order.
- Use Pivoting to reorganize rows and columns.
-
Click the “Run Report” Button
- The button appears blue and clickable when new selections or changes have been made.
- Clicking the button updates the table to reflect all applied changes.
Note: Reports do not update automatically. Any change in Measures, Dimensions, Filters, Sorting, or Pivoting requires you to re-run the report.
By selecting multiple options before clicking Run Report, users can efficiently generate and refine reports in a single action.