Customizing your study’s display ensures quick access to essential information and data for your team.
- Navigate to Study Settings:
- Locate the Study Settings tab.
- Access Display Settings:
- Within Study Settings, find the Display section.
- Customize Display:
- Adjust settings based on your team’s needs for easier access to relevant data.

Customizable Display Settings
Ripple allows you to customize primary display settings to enhance accessibility and usability.
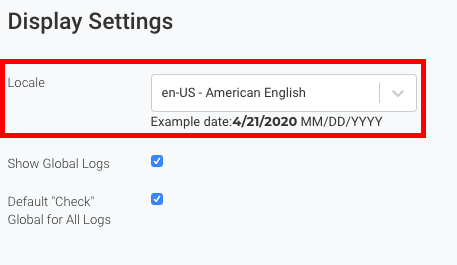
1. Set Locale
-
- By default, Ripple adopts the local settings of the computer it is being used on.
- If needed, you can manually adjust the time and date settings to match your preferred locale.
Global Log Settings
Ripple provides Global Log Settings to manage log visibility and sharing across studies. These settings control how log entries appear in a participant’s profile.
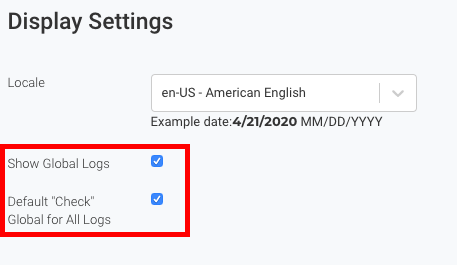
1. Show Global Logs
-
- When enabled, Global comments in a participant’s log from the Registry or another study will be visible in the current study’s log.
- This setting helps maintain continuity of participant records across multiple studies.
2. Default ‘Check’ Global for All Logs
-
- When enabled, all new entries in the Comments, Email, Contact, and Consent Logs are automatically marked as Global by default.
- You can manually uncheck this setting for logs that should remain study-specific.

Combined Status View Overview
When you enable the Combined Status View in Ripple, the system displays all Potential Participants across all statuses in a single, continuous list—without separating them by status headers.
Key Behaviors:
-
The status group headers (e.g., “Contacted,” “Screened,” “Eligible”) are removed from the view.
-
Participants are not grouped by status; instead, they appear as one consolidated list in the Status Table.
- The participant's status now appears in a column.
-
This view is useful when you want to apply filters, sort participants, or take bulk actions across statuses without having to scroll through each grouped section individually.
Use Case Example:
If you’re trying to export or review all Potential Participants regardless of where they are in your recruitment workflow, enabling Combined Status View provides a streamlined way to see and manage them all at once.
-
Navigate to the Study Settings for your current study.
-
Scroll to the Display section.
-
Toggle on the setting labeled "Combined Status View".
New Status Page (introduced June 2025)
Display Option – Wider or Full-Screen View:
Ripple has introduced a layout enhancement allowing users to expand the Participant Profile Card(Potential or Enrolled) to a wider or full-screen view.
To enable this option:
-
Navigate to the Study Settings for your current study.
-
Scroll to the Display section.
-
Toggle on the setting labeled "New Status Page".
This view is especially useful when reviewing large amounts of data, or navigating complex custom variables and survey history. Any changes you make to the screen view will only affect your view; it will not affect other Ripple ursers.
Note: Combined Status View and New Status Page cannot be enabled at the same time. Depending on your workflow and the section of Ripple you're working in, each view offers different advantages:
-
Combined Status View: Ideal when managing participant statuses, as it displays all statuses together in a single list without headers. This can be helpful for bulk actions, reviewing data across statuses, or quickly scanning your full participant list.
-
New Status Page: Useful when you want to adjust the display size of the participant profile card or take advantage of updated layout improvements for easier navigation and a more customized view.
Choose the view that best supports your current task, and feel free to switch between them as needed.
Potential Participants Column Settings
Ripple allows you to customize the variables displayed on the Potential Participants page by selecting key variables that are most relevant for managing participant enrollment.
1. Access Column Settings
-
- Navigate to the Potential Participants page.
- Locate the Column Settings customization option.
2. Select Variables
-
- Choose variables that are most relevant for your team’s enrollment process.Click the green "Add Columns" button to select the variables you want to display.
- These variables will be displayed on the Potential Participants page for quick access.
- Avoid selecting too many columns, as this can negatively impact how the data is displayed, making it harder to read and manage effectively.
3. Save and Apply Changes
-
- Confirm your selections.
- Changes or additions made will autosave.
The selected columns will now appear for all users managing participant enrollment.

Enrolled Participants Column Settings
Ripple allows you to customize the Enrolled Participants tab to display important variables in a format similar to the Potential Participants tab.
1. Access Column Settings
-
- Navigate to the Enrolled Participants tab.
- Locate the Column Settings customization option.
2. Select Variables
-
- Choose variables that are most relevant for your team’s enrollment process.Click the green "Add Columns" button to select the variables you want to display.
- These variables will be displayed on the Enrolled Participants page for quick access.
- Avoid selecting too many columns, as this can negatively impact how the data is displayed, making it harder to read and manage effectively.
3. Choose Your Display Format
You can customize the display with the following options:
-
- Displaying Events: This allows you to see the progress of each participant through study events, including:
- Add Events
- Click the check box to add events as the remaining columns.
- Easy access to mark events as completed by clicking the event's checkbox.

4. Save and Apply Changes
-
- After selecting your preferred variables and display options, the changes will autosave.
- The updated columns and event details will appear in the
